This section describes simple steps to design a report using the Report Designer.
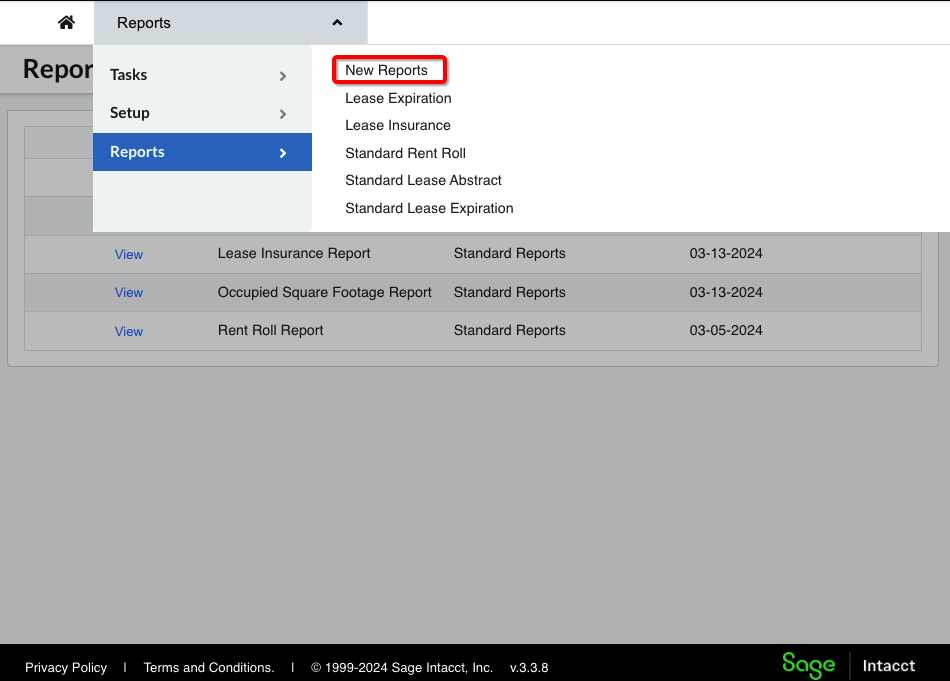
Open Reports section
-
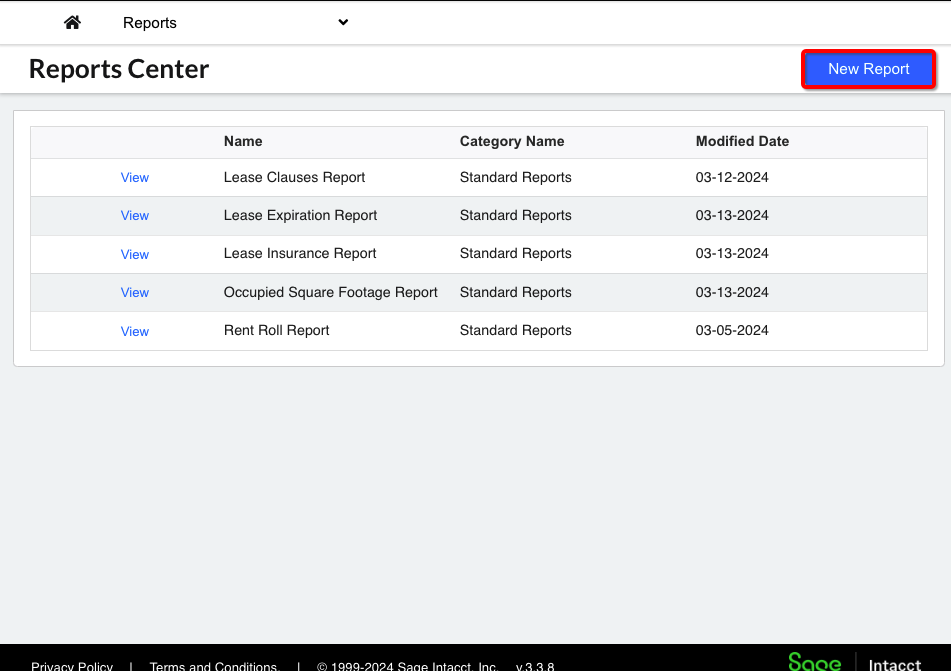
Click on Report to pull the list of new Standard Reports. You will se a “New Report” button on the top right corner.
Create Data
-
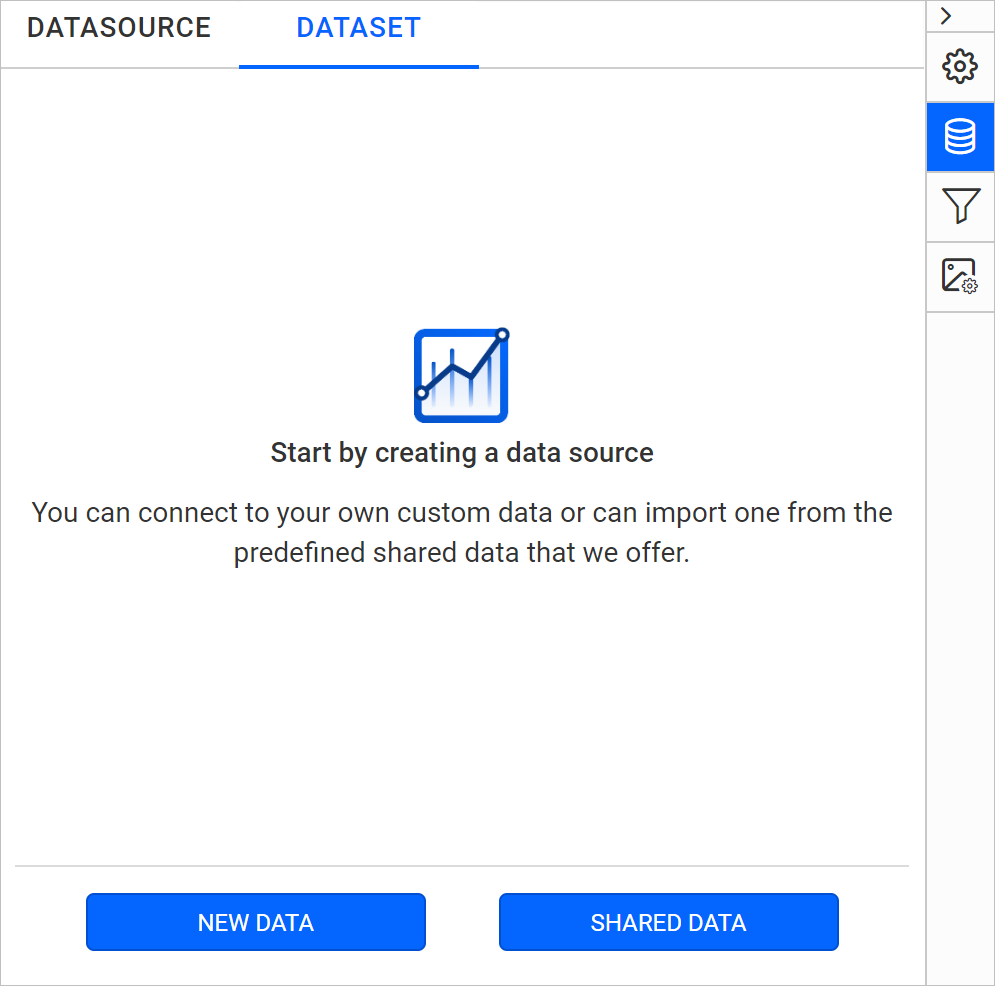
The first step before you design a report is to create a data connection. To add a data, click on the Data icon in the Data Configuration panel. It opens the Data panel.
-
Click on New Data button in the data panel.
-
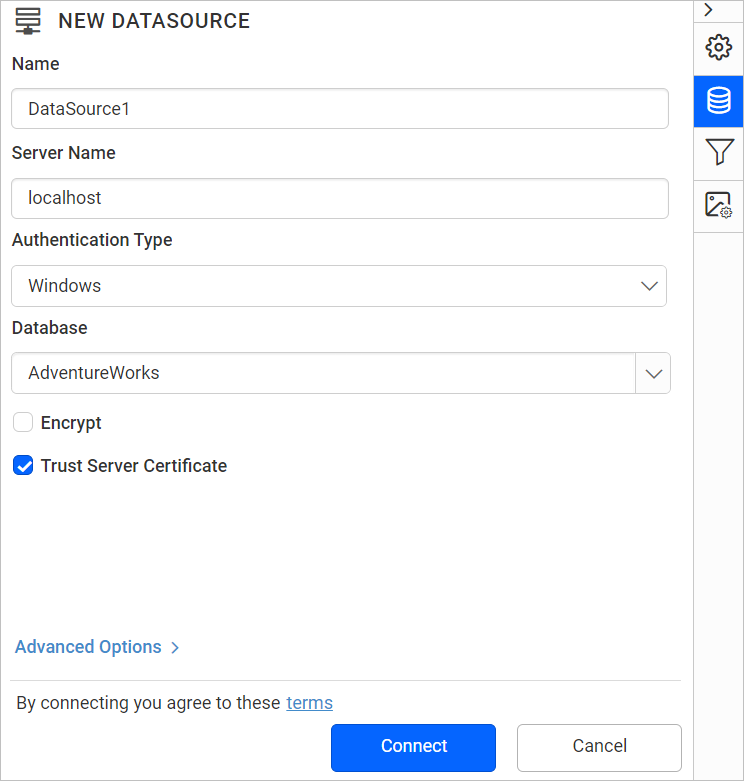
Refer to link to a shared data source to select your Data source connection.
-
Click the Connect button. Now the following view will be displayed.
Here, an AdventureWorks database is used for demonstration.
Edit dataset name
You can edit the name of the Data in the Name field that is available in toolbar pane.

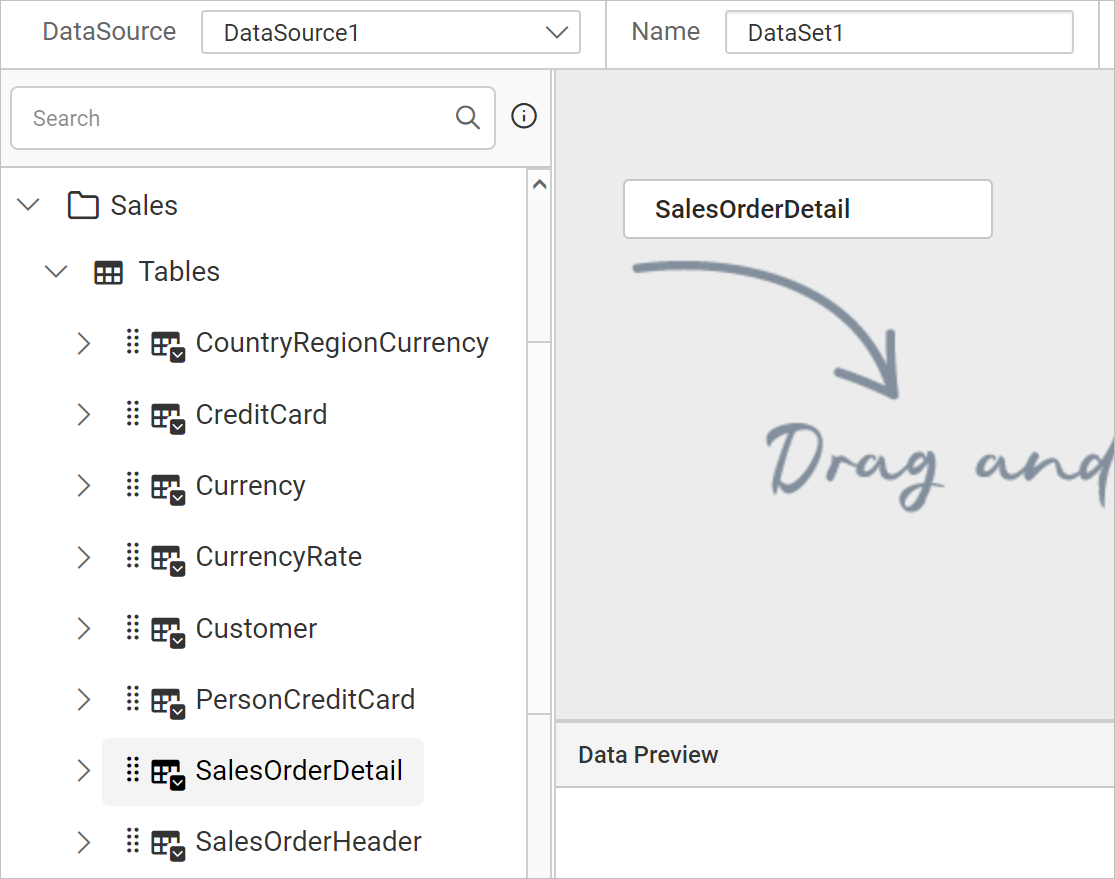
Drag and drop table in query designer
The left pane holds the tables, views, and procedures associated with the connected database. Drag your preferred table or view from the left pane and drop into the center pane labeled with Drag and Drop table here like below:
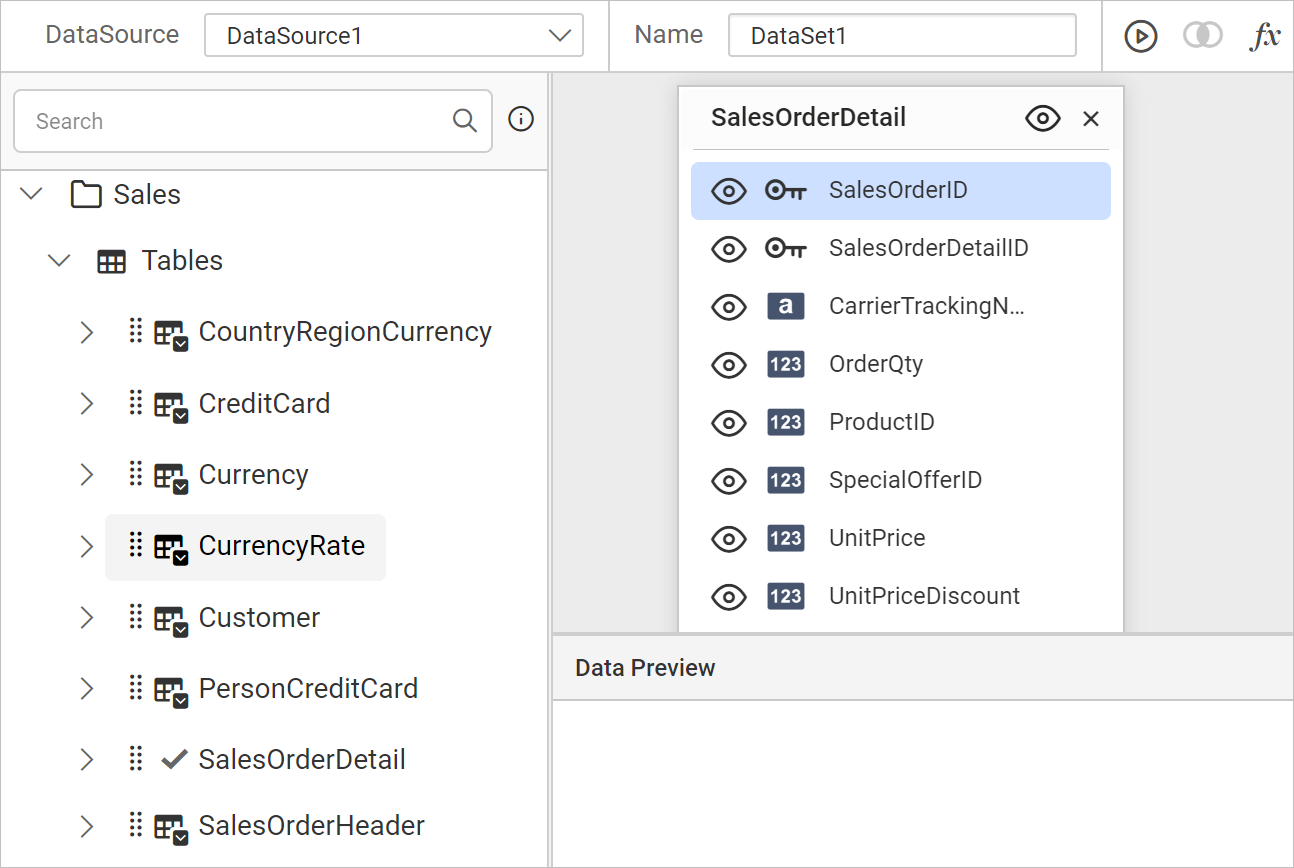
Now, the table will be dropped in the design area like below.
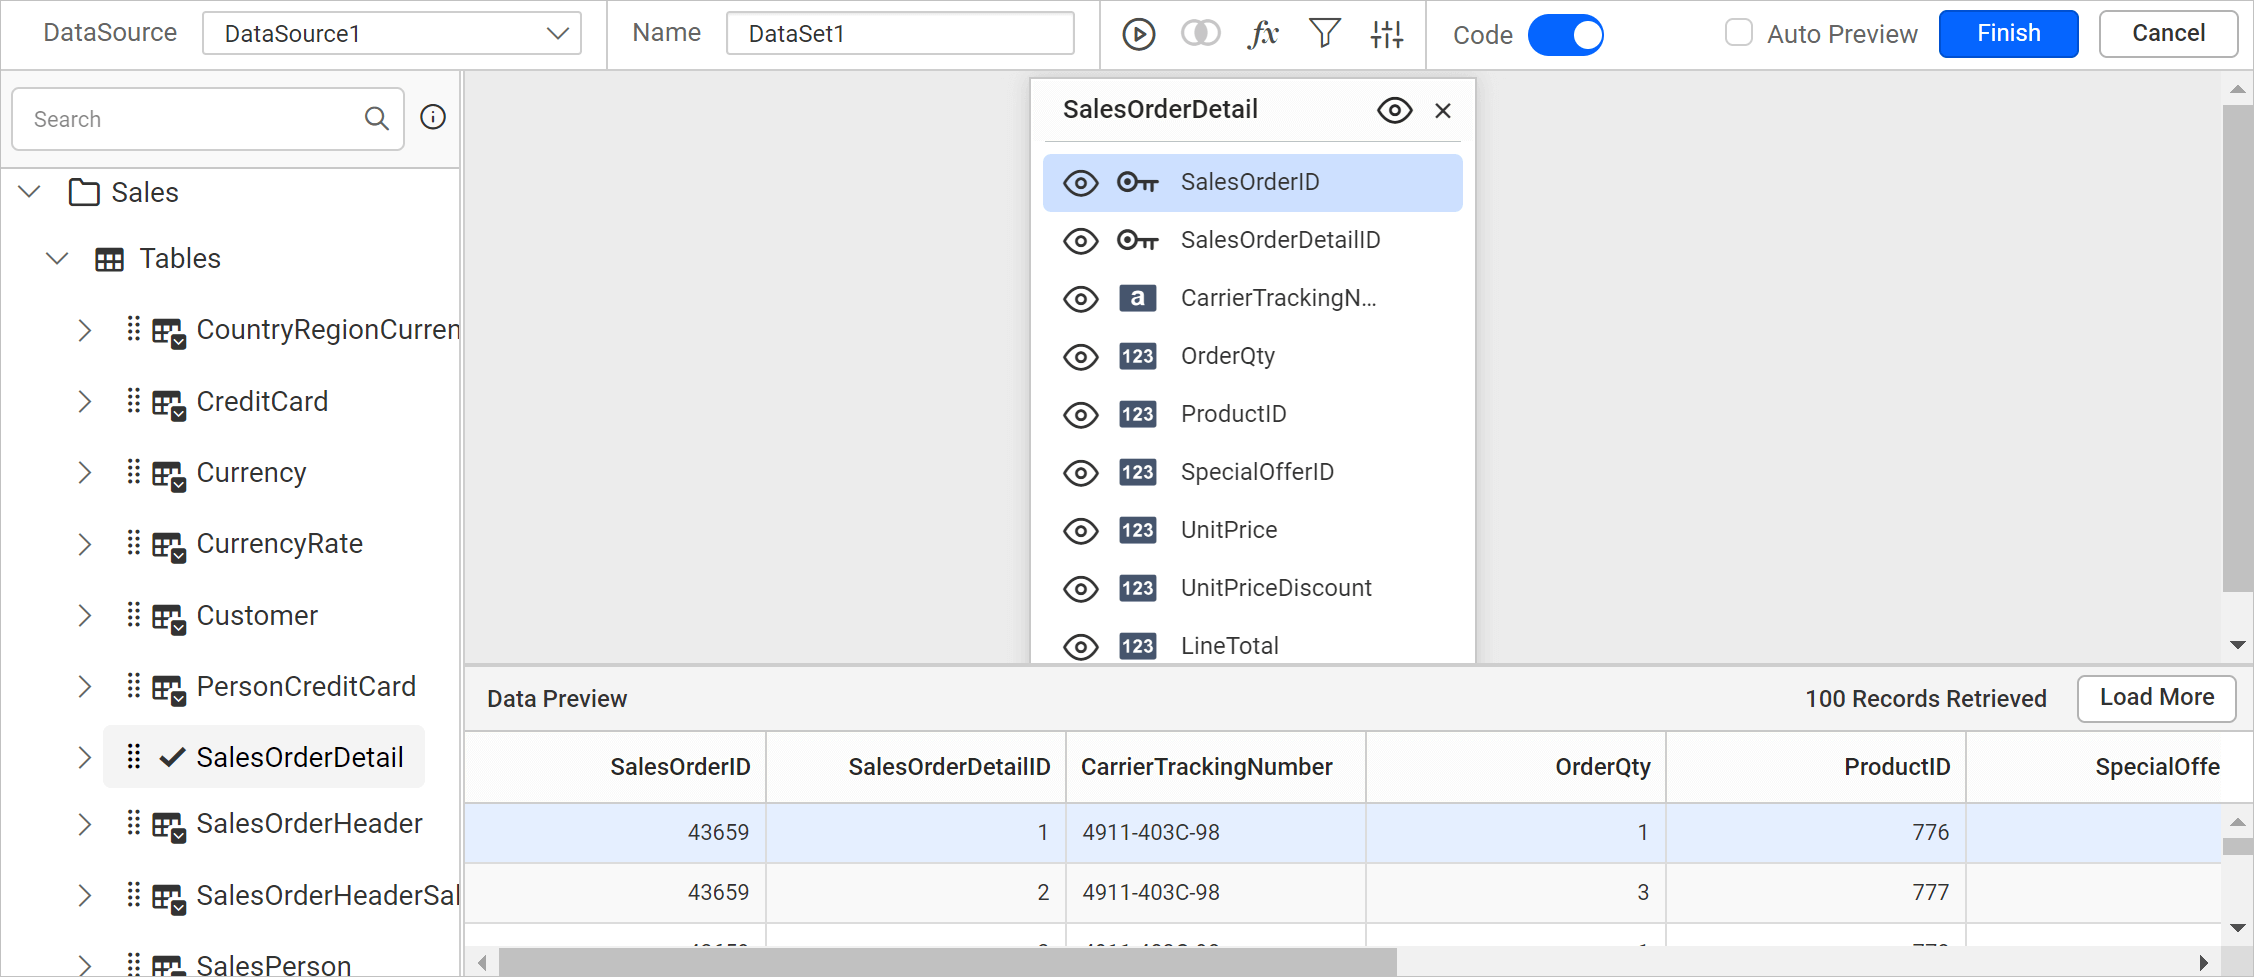
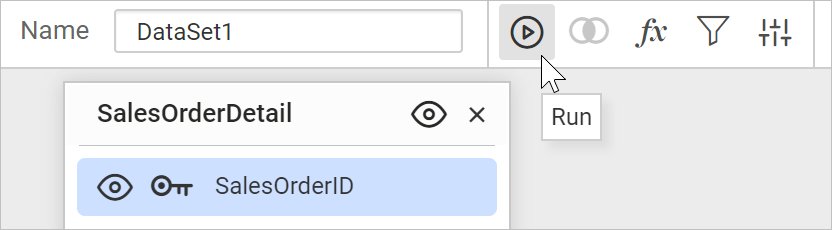
Execute query
-
You can execute and visualize the data by using Run option in tools pane.
-
Now, the data will be retrieved based on the specified query.
Save Data
-
Click on the Finish button in the tools pane.
-
Your dataset should now be listed in the Data panel like below.
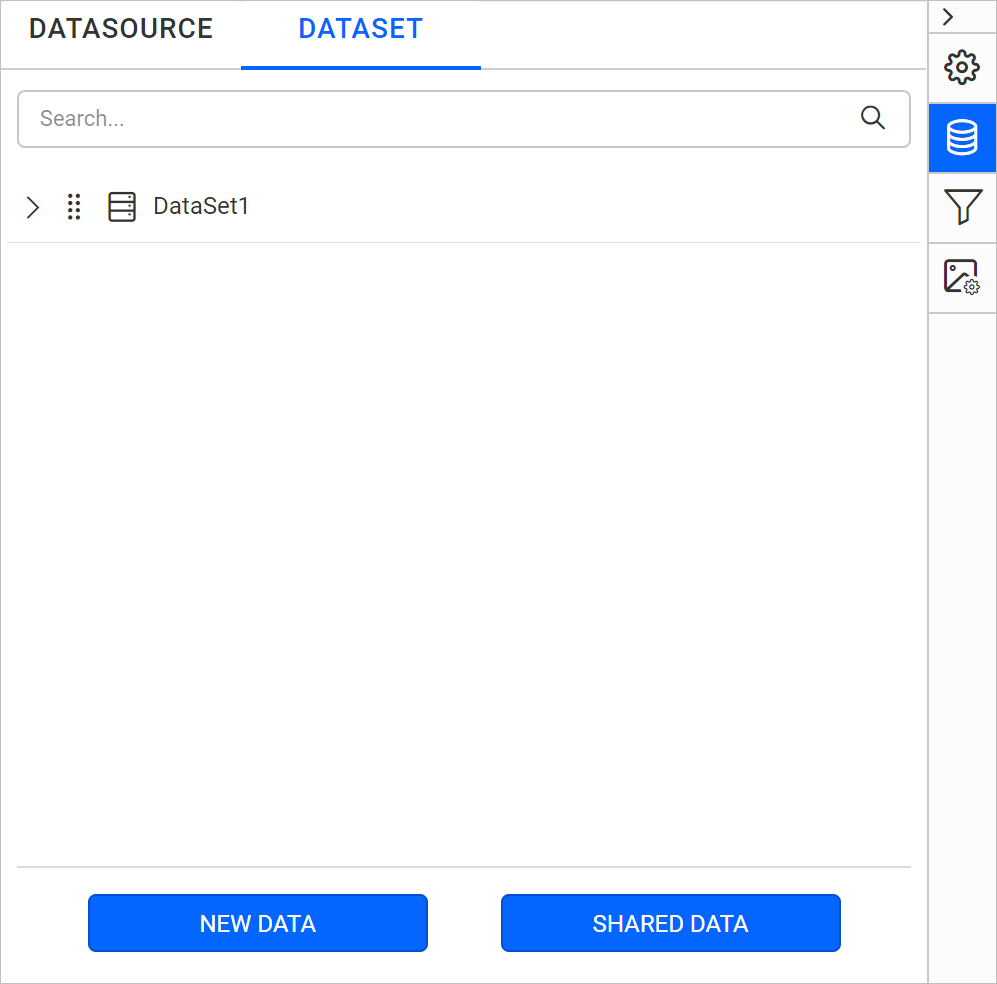
-
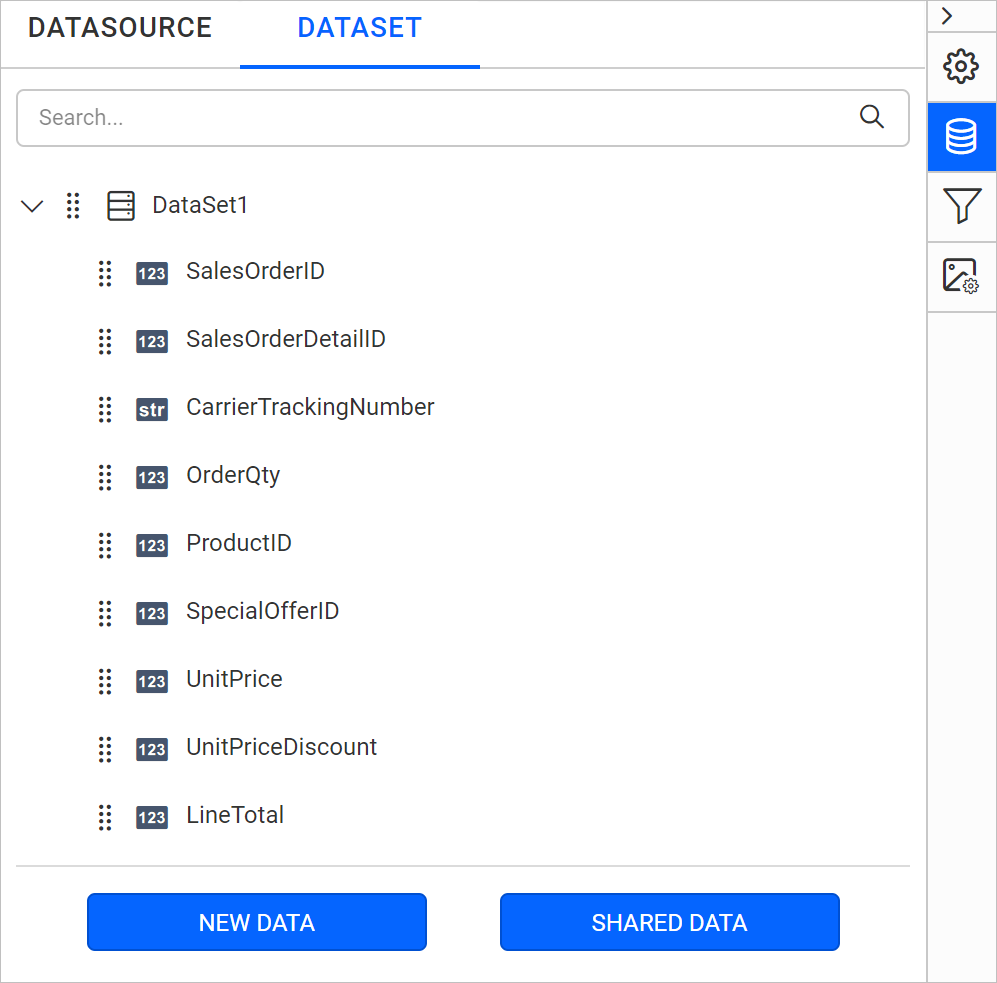
Expand the icon to view the data fields.

Add table report item
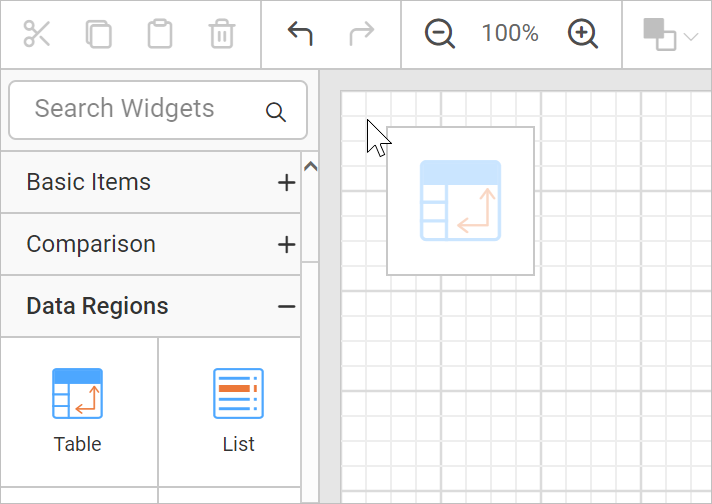
The left pane in the design view consists of basic items, data region, data visualization, and sub reports to design an interactive report.
-
Select the Table item under Data Regions in the item panel, then drag and drop it to the design area.
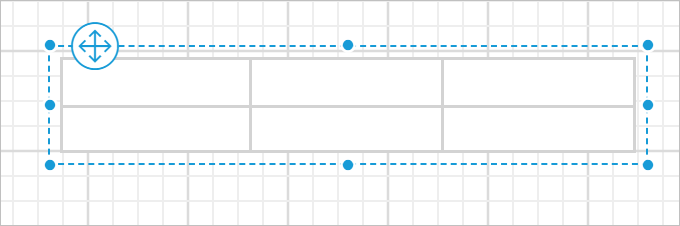
-
The above action will render the Table with two rows and three columns in the design area.
Assign data
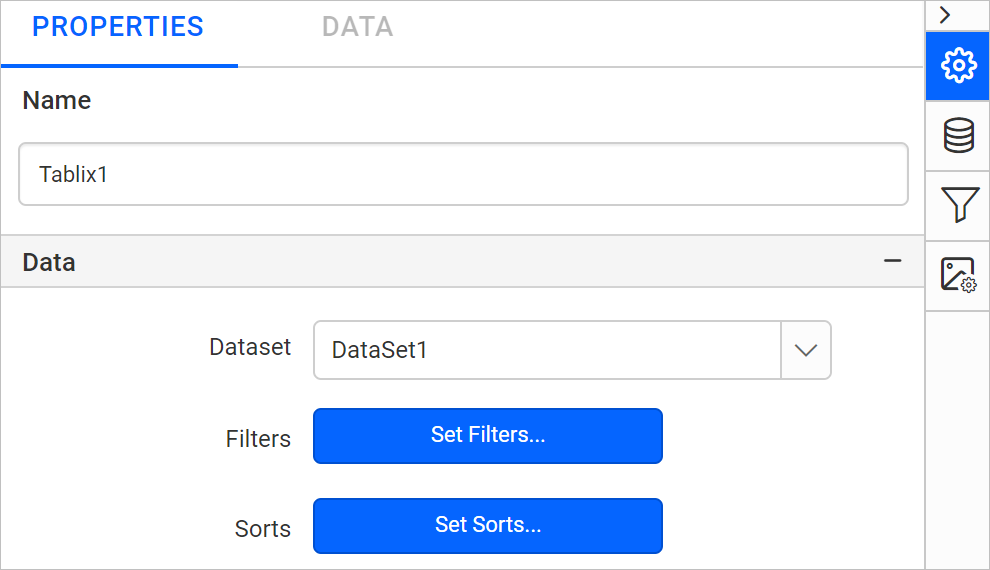
This step is applicable only for the report items that belongs to data visualization and data region category.
Assign the dataset to the Dataset property of the table.
Add column header
-
Select the first cell in the table, and enter the column header text as ProductID to the Content property of table.
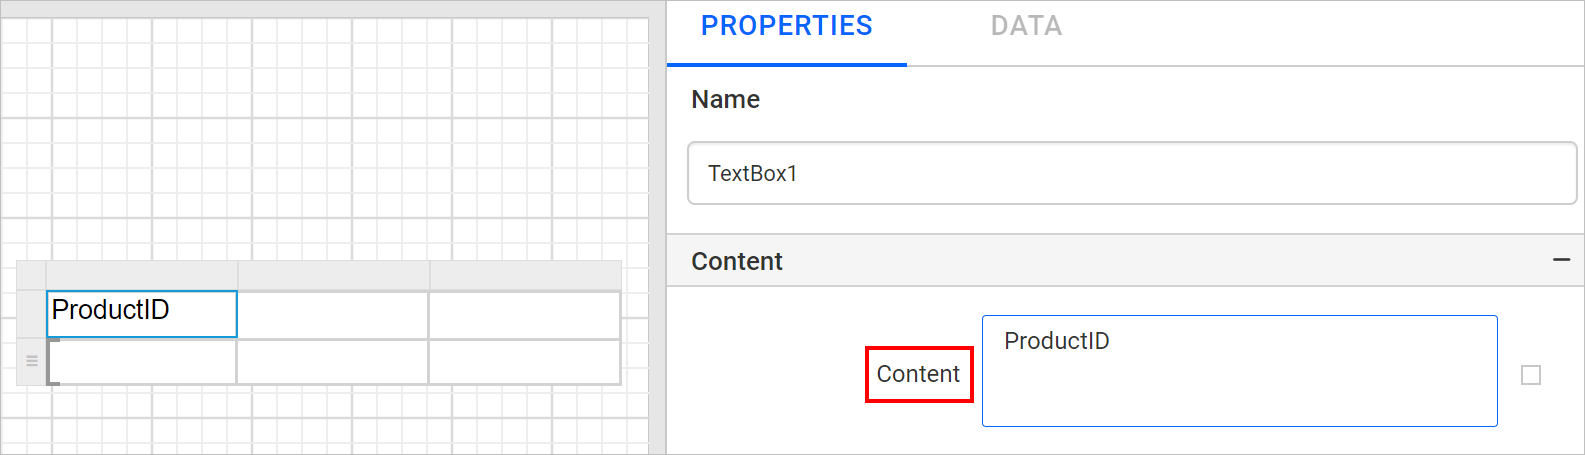
-
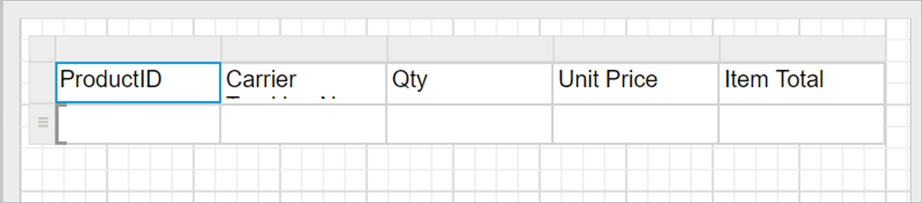
Similarly, you can add required column header text to other cells in the table.
Assign data fields in table cell
-
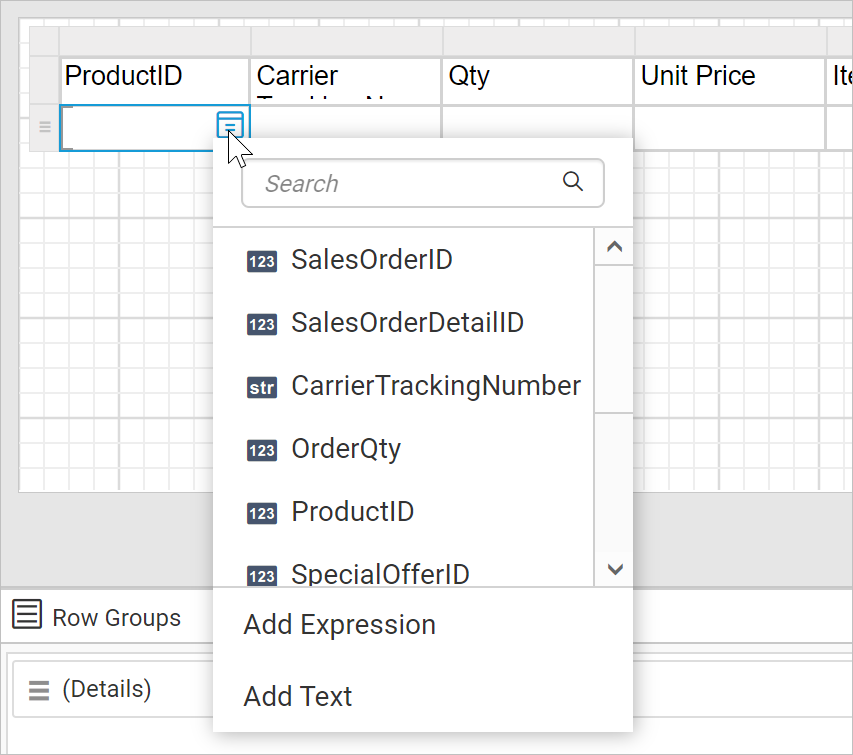
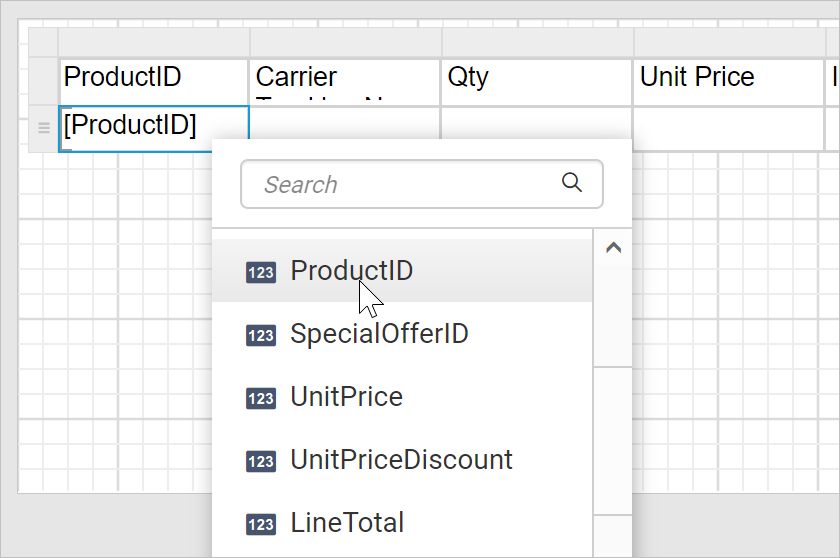
Select the table cell and click on the Data assign menu icon to open data assign menu.
-
Assign the ProductID field in the table cell.
-
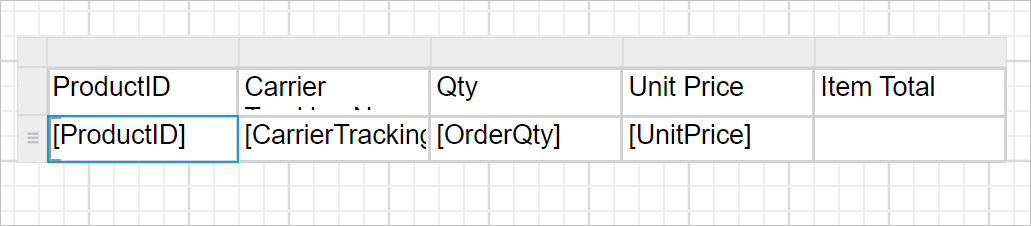
Similarly, you can assign the required data fields to the table cell.
-
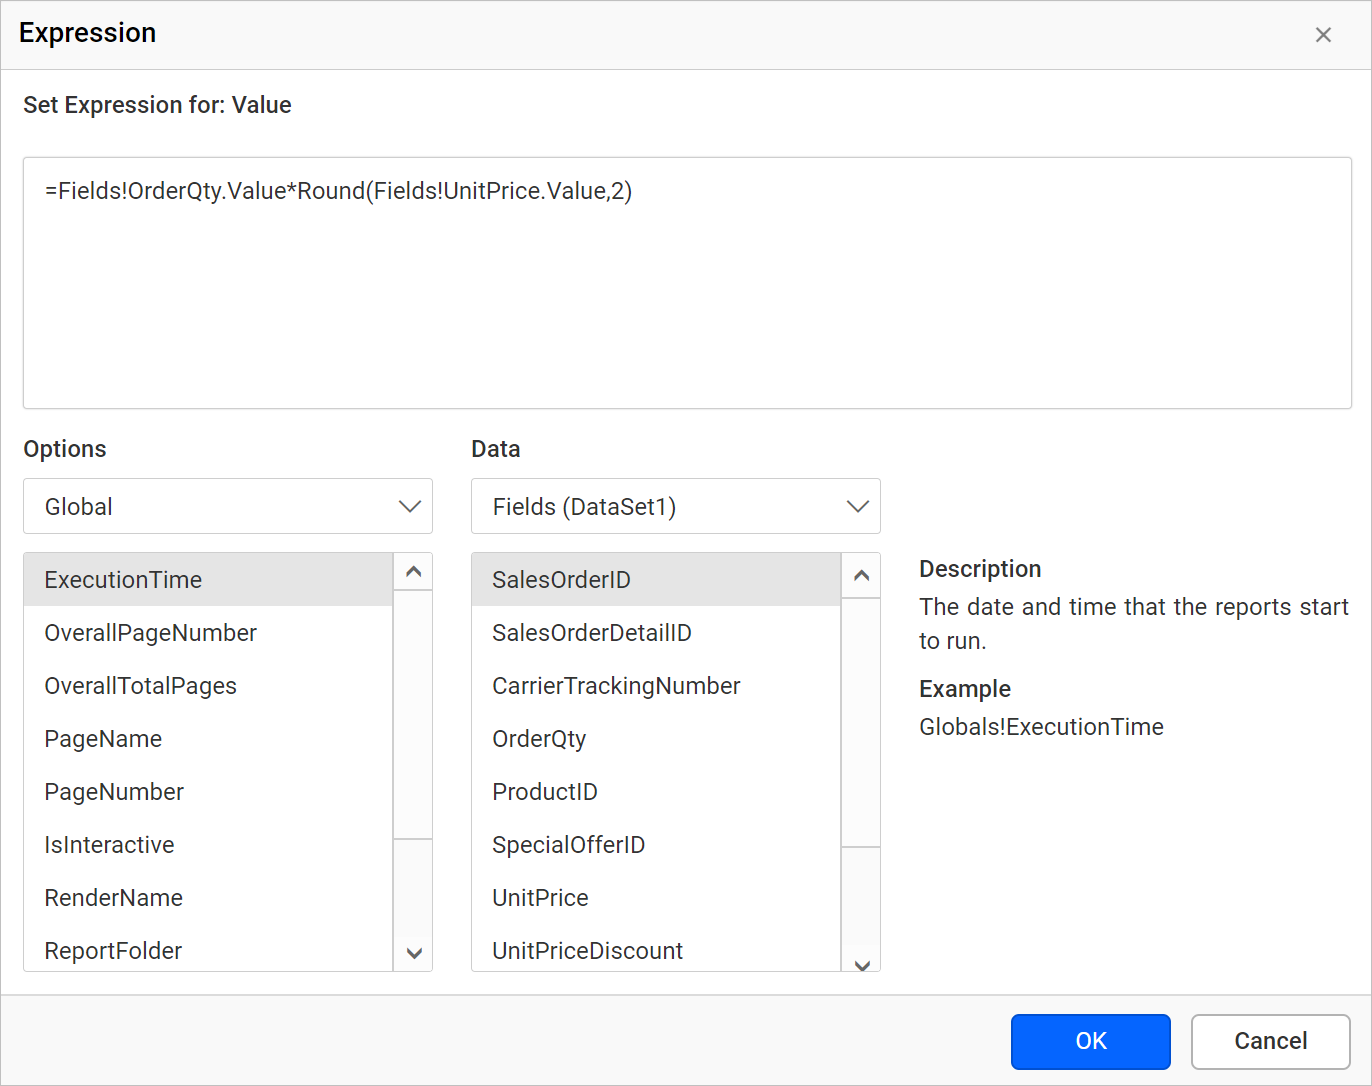
Assign expression to the table cell.
-
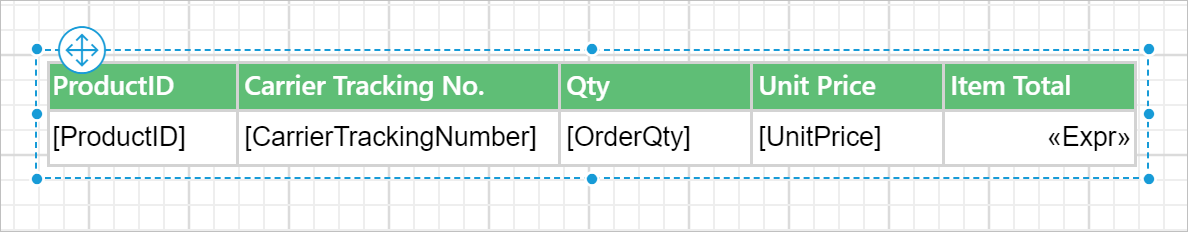
In the expression dialog, add the following expression =Fields!OrderQty.Value*Round(Fields!UnitPrice.Value,2) and click OK.
-
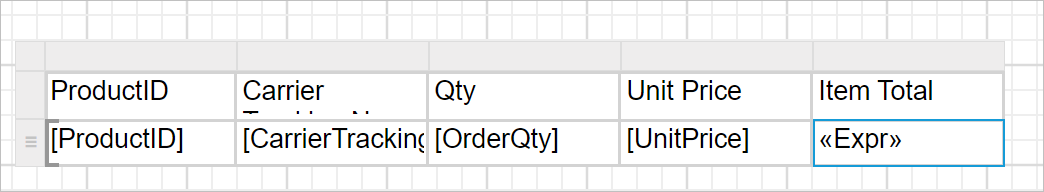
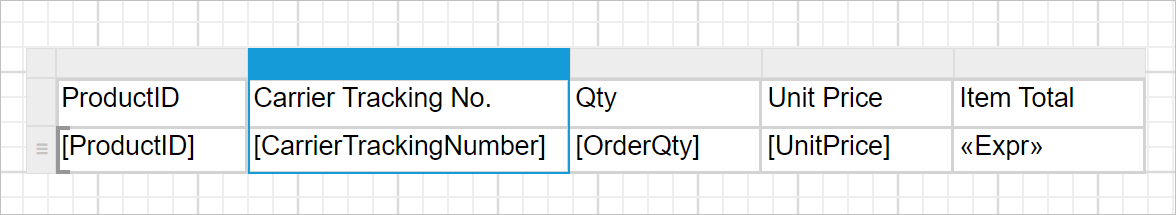
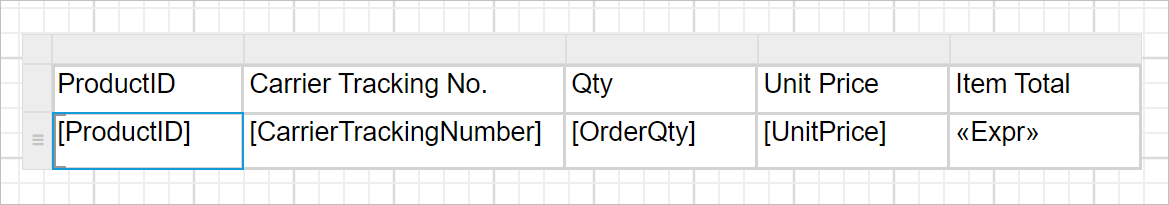
Now, the table will look like below,
Resize the column
To improve the report readability, we can resize the table row height and column width.
-
Place the mouse pointer in the respective column border.
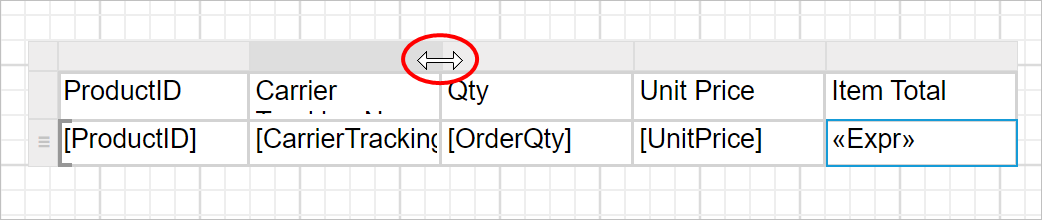
-
Drag the column gripper horizontally, to adjust the column width.
Resize the row
-
Place the mouse pointer in the respective row border.
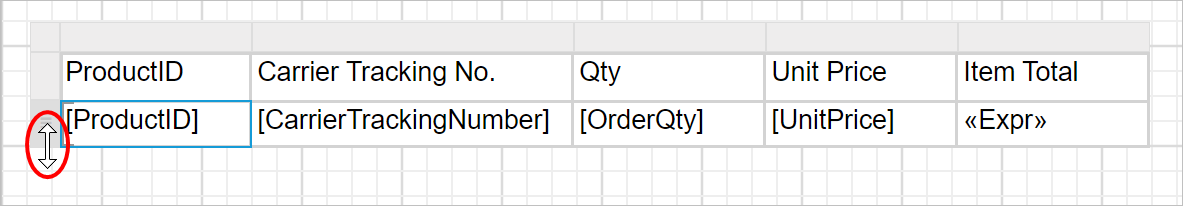
-
Drag the row gripper vertically, to adjust the row height.
Customize the appearance
Open the PROPERTIES pane. This pane holds some general settings and some specific to the report item.
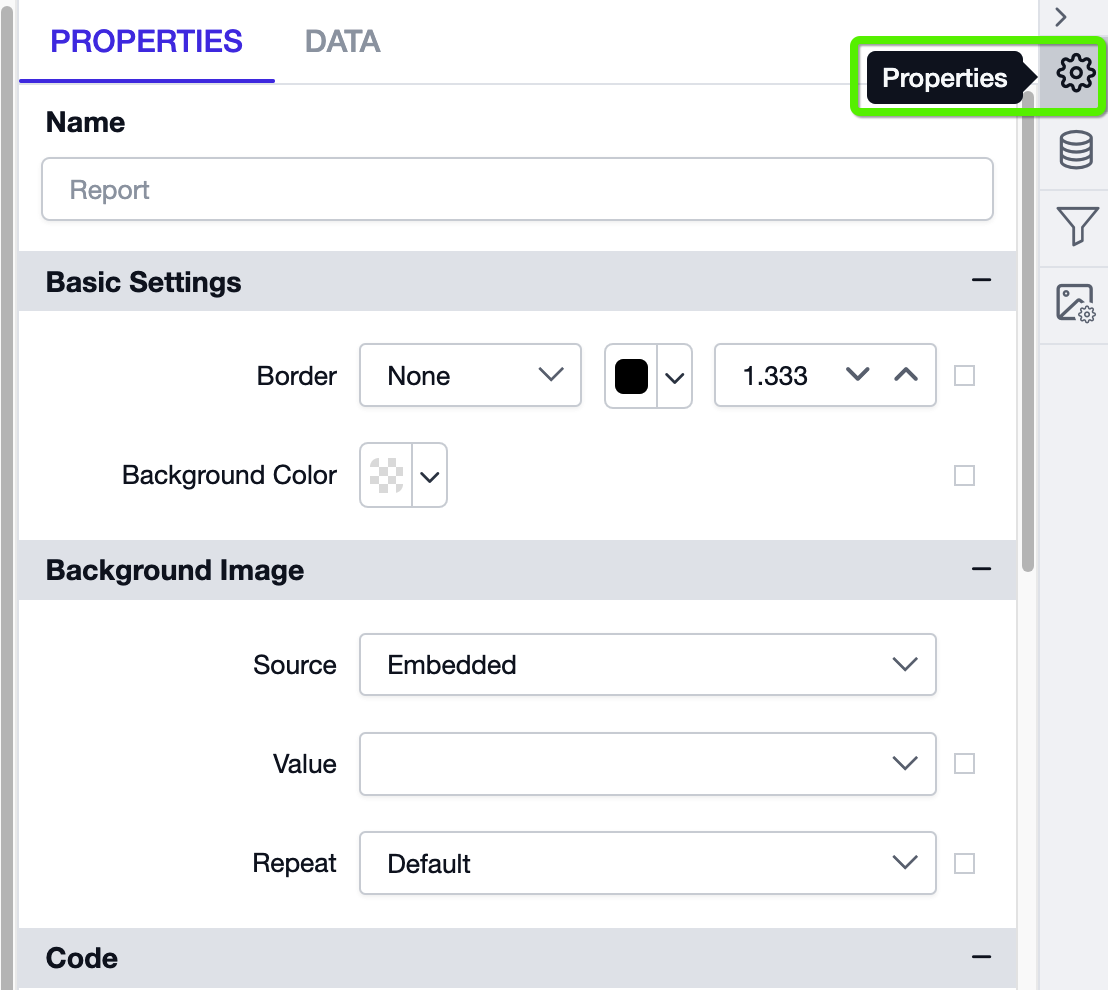
Configure the desired settings to the table for better report design and to improve report readability.
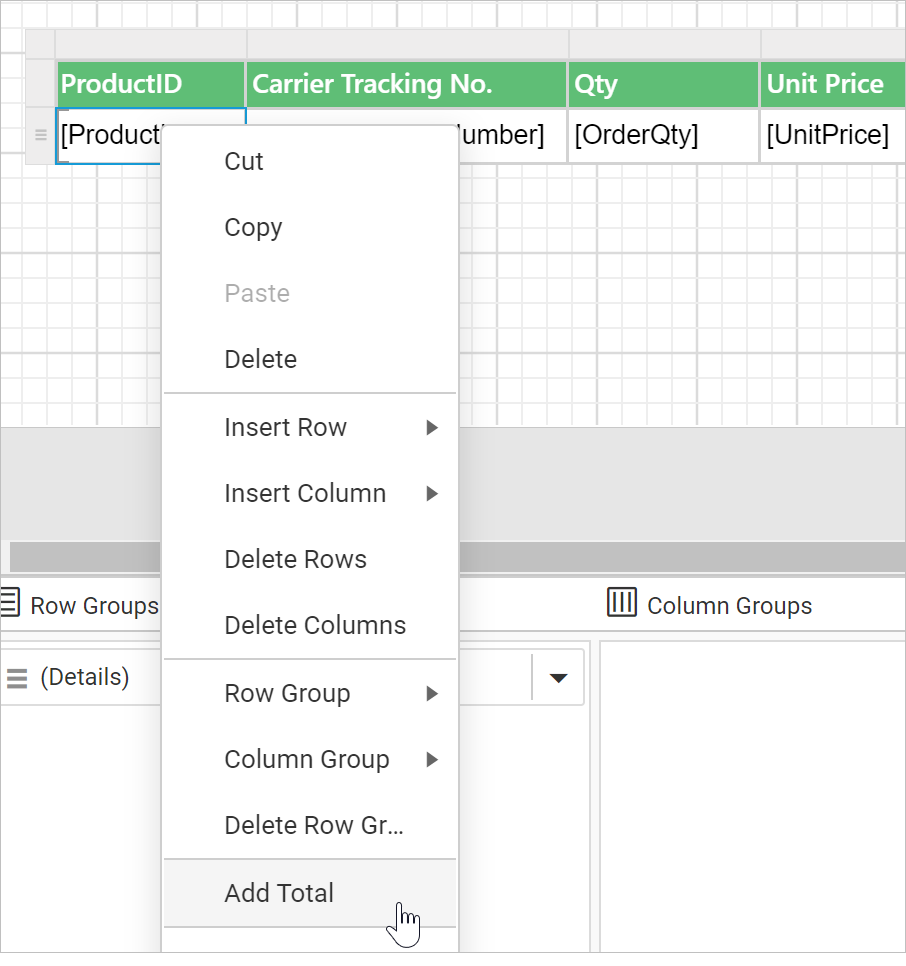
Add total
-
Select the second row, first cell and Right click -> Add Total
-
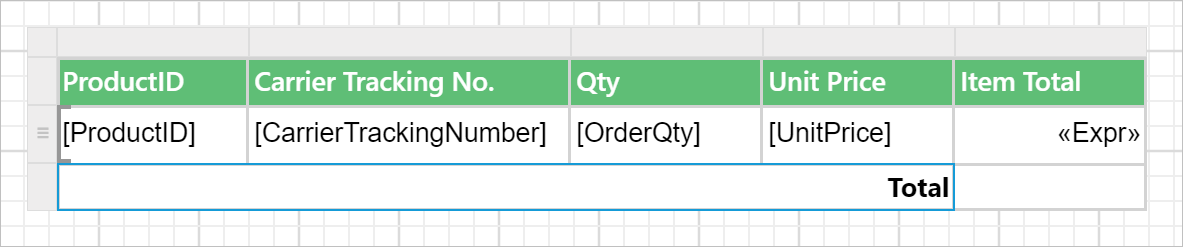
Now, select the third row, first four columns and Right click -> Merge cells
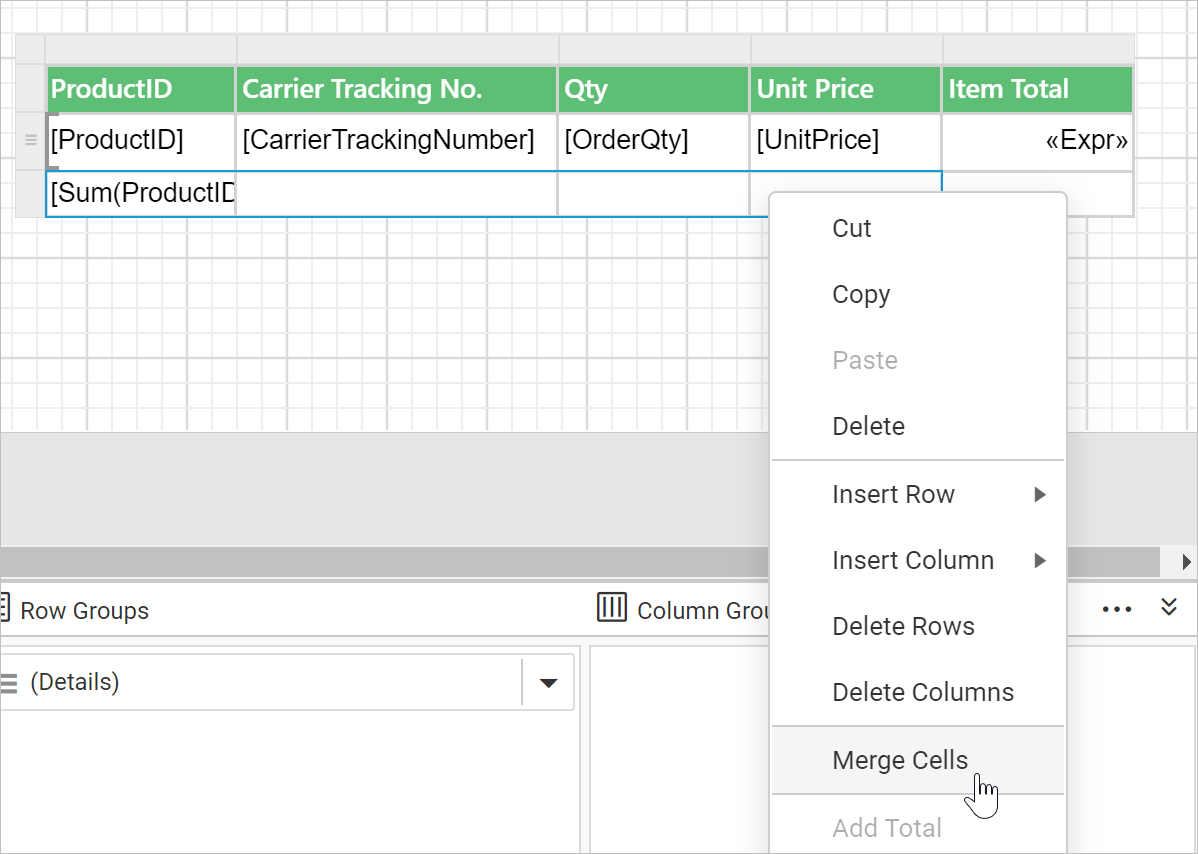
-
Modify the cell content as Total and align the content to Right side.
-
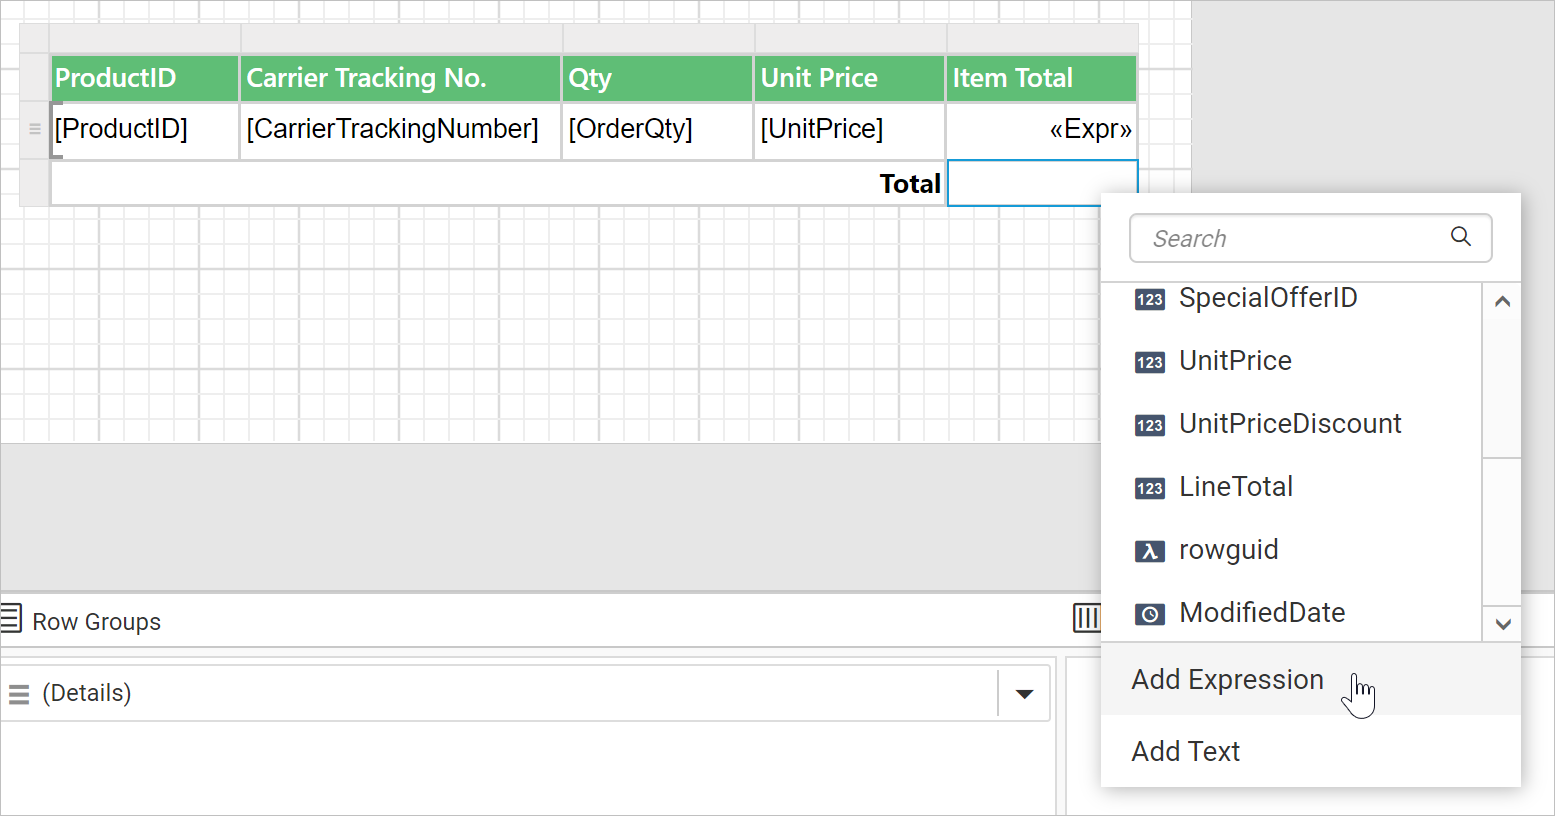
Select the third row, last cell and open the Data Assign menu. Then, click on Add Expression.
-
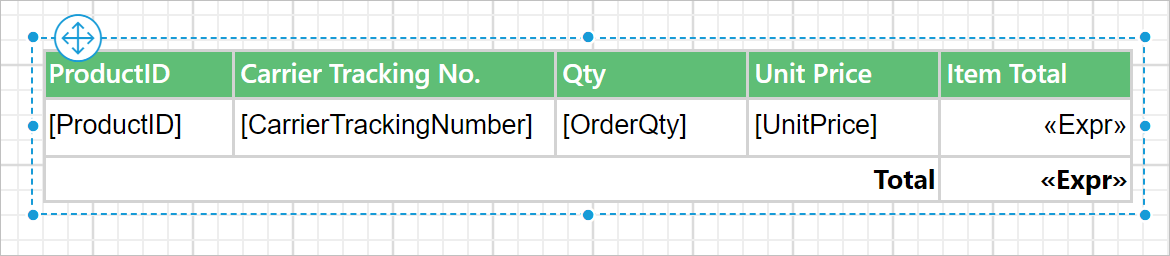
In the expression dialog, add the following expression =Sum(Fields!OrderQty.Value*Round(Fields!UnitPrice.Value,2)) and click OK.

Now, the table design will look like below.
Save report
Once you are done with the report designing, to save a report refer How to save report section.
Preview report
-
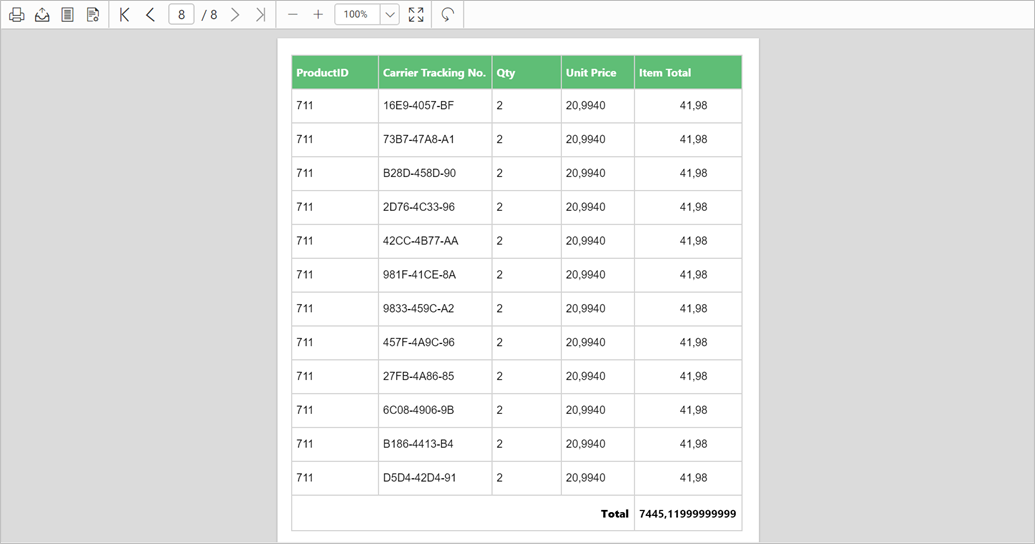
To see the report preview, click on the Preview button in the report header.
-
Now, the report preview can be visualized like below.