1. Introduction
Purpose
The Occupied Square Footage Report helps users review how square footage is distributed across occupied and vacant units within a property as of a selected date.
It is intended to support occupancy review by showing unit-level detail together with property-level occupancy totals.
Aggregation Level
This report is presented at the unit level and grouped by Property and Unit Class.
It shows each unit's occupancy status, tenant and lease information, occupied and vacant square footage, and the percentage of the property represented by each unit.
2. How to Use the Report
Step 1 - Select Filters
Open the report and set the parameters in the following order:
-
Entity_Id (multi-select)
-
Property Name (multi-select)
-
As of Date
-
Unit Class (multi-select)
-
Month to Month (multi-select)
-
Unit Status (multi-select)
Step 2 - Run the Report
After selecting the parameters, run or refresh the report.
Step 3 - Validate Header Information
At the top of the report, verify the following:
-
Occupied Square Footage Report
-
Execution date
-
As of Date
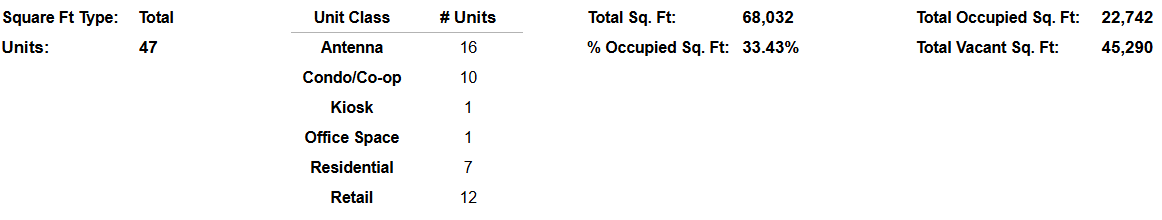
Step 4 - Review the Summary Metrics
At the top of the report, review the summary metrics:
-
Square Ft Type: using Total by default
-
Total Sq. Ft.
-
Total Occupied Sq. Ft.
-
Units
-
% Occupied Sq. Ft.
-
Total Vacant Sq. Ft.
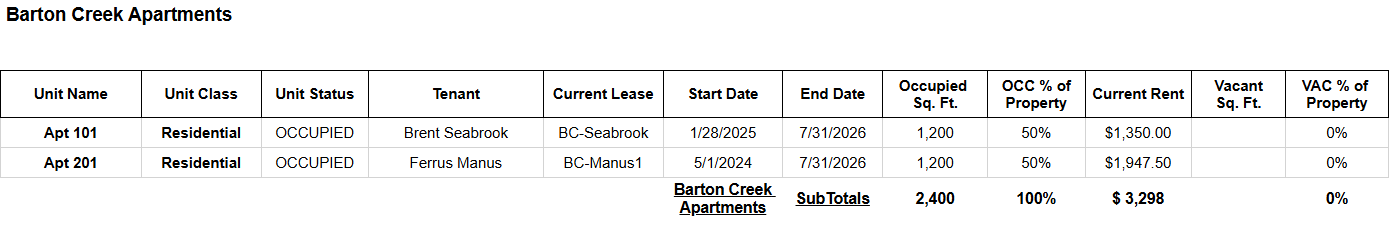
Step 5 - Review the Detail Table
The detailed section is grouped by Property and then lists unit-level rows using these visible columns:
-
Unit Name
-
Unit Class
-
Unit Status
-
Tenant
-
Current Lease
-
Start Date
-
End Date
-
Occupied
-
OCC % of Property
-
Current Rent
-
Vacant
-
VAC % of Property
Expected Display
-
The report groups detail rows by Property with a page break at the detail table per property.
-
Each row represents one unit record in the selected reporting context
-
Summary metrics reflect the same filters used for the detail section
-
Subtotal rows help users understand totals within each property
3. Technical Explanation
Date and Filter Behavior
This report shows occupancy as of a single selected date.
It is not a trend report across multiple months. Instead, it provides a point-in-time view of how much square footage is occupied and vacant for the selected properties.
This report applies filtering using the following parameters:
-
Entity_Id
-
Property Name
-
As of Date
-
Unit Class
-
Sq. Ft. Type
-
Month to Month
Table Structure
The report contains two functional sections:
Summary Section
The top summary section shows:
-
total square footage for the selected property set
-
total occupied square footage
-
total vacant square footage
-
number of units returned
-
overall percentage of occupied square footage
Detail Section
The detail table is built at the unit level and grouped by Property and Unit Class.
This structure allows users to review both detailed unit records and the broader property-level occupancy picture in the same report.
The report also includes lease context such as:
-
Tenant
-
Current Lease
-
Start Date
-
End Date
This helps users understand which active occupancy relationship is tied to the square footage being shown.
Granularity Explanation
The report is built at the unit level because occupancy and square footage are evaluated unit by unit.
The Occupied and Vacant columns show how each unit contributes to the total property square footage, while OCC % of Property and VAC % of Property show each unit's proportional impact.
Grouping by property and unit class makes it easier to review both detailed records and subtotals in the same layout.
4. Troubleshooting
No Data Returned
Possible causes:
-
The selected Property Name values are incorrect
-
The As of Date falls outside a period where units and active leases exist for the selected properties
-
Other filters such as Unit Class or Month to Month are narrowing the results too much
Possible fixes:
-
Confirm the selected Property Name values
-
Try a different As of Date
-
Remove some optional filters and rerun the report
Units Are Missing from the Report
Possible causes:
-
The units do not match the selected Unit Status retrieved from Intacct
-
The units do not match the selected Unit Class and property filters
-
The selected date does not reflect the occupancy period you want to review
Possible fixes:
-
Verify the selected Unit Class values
-
Confirm the selected property values
-
Adjust the As of Date and rerun the report
Square Footage Totals Seem Lower Than Expected
Possible causes:
-
The selected Sq. Ft. Type changes the values shown
-
Some units may be excluded by the current filters
Possible fixes:
-
Review the Sq. Ft. Type used in the report output
-
Compare the unit-level detail with the property summary to identify excluded units or vacant space
Occupied or Vacant Percentages Seem Incorrect
Possible causes:
-
The report is being interpreted as a trend instead of a point-in-time view
-
The occupied and vacant contribution columns are not being reviewed together
Possible fixes:
-
Review Occupied, Vacant, OCC % of Property, and VAC % of Property together
-
Confirm that the report is being interpreted based on the selected As of Date
5. Customization
Possible enhancements for this report include:
Summary Enhancements
-
Adding more summary metrics at the property level
-
Expanding the occupancy summary section for portfolio analysis
Layout and Grouping Changes
-
Changing the grouping sequence for easier review
-
Adjusting how subtotals are displayed
Field Customization
-
Adding or removing detail columns such as lease or tenant information
-
Adjusting export formatting for downstream occupancy or leasing reviews
These modifications can be requested as a report customization through the customer portal.