1. Introduction
Purpose
The Projected Revenue Report in Sage Intacct Real Estate provides you with a forecast of expected revenue over a specific period for each lease. This report shows monthly and annual revenue projections, helping you plan and track future income based on lease agreements.
The report helps users review expected lease revenue across a selected future date range. It is designed to show projected amounts by month and by year so users can evaluate upcoming revenue by property, lease, and charge item.
Key Sections of the Report
-
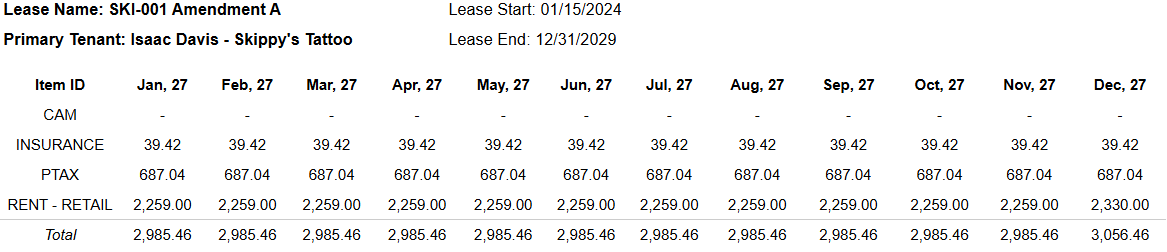
Lease Details: At the top, you’ll see basic information about the lease, including the lease name, primary tenant, lease start and end dates, and property name.
-
Monthly Revenue Breakdown: Each month’s projected revenue is displayed for different revenue categories (e.g., Base Rent, PTAX). This breakdown allows you to see expected income month-by-month.
-
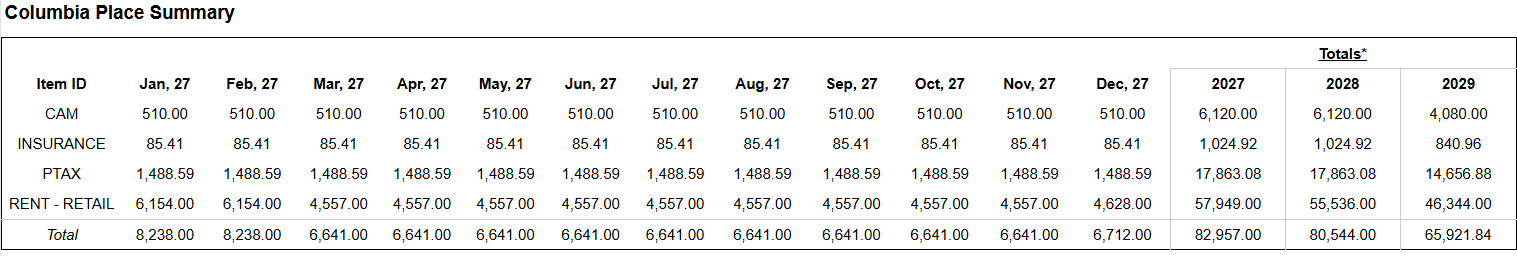
Annual Totals: Below the monthly breakdown, annual totals are calculated for each revenue category, giving you a clear view of the overall expected revenue for each year in the report period.
-
Grand Totals: At the end of the report, you’ll find a summary of the total projected revenue, combining all categories and providing a cumulative figure for each year.
Use this report to monitor projected revenue, compare it to actual revenue, and make informed financial decisions about your property portfolio. The breakdowns help you understand revenue fluctuations, while the annual summaries provide high-level insight into each lease's financial contribution.
Aggregation Level
This report is presented at multiple levels.
Information is grouped by:
-
Property
-
Lease Name
-
Item ID
This structure allows users to review both summarized totals and detailed projected revenue lines within the same output.
2. How to Use the Report
Step 1 - Select Filters
Open the report and set the parameters in the following order:
-
Entity ID (multi-select)
-
Property Name (multi-select)
-
From Date
-
To Date
-
Item ID (multi-select, optional if you want to limit the report to specific revenue items)
-
Lease Status (multi-select, by default using all type of available status)
-
Month to Month (multi-select)
Step 2 - Run the Report
After selecting the parameters, run or refresh the report.
Step 3 - Validate Header Information
At the top of the report, verify the following:
-
Projected Revenue report title
-
Execution date timestamp
-
From Date
-
To Date
Step 4 - Review the Lease Context
Within each property section, the report displays lease and item-level context fields such as:
-
Lease Name
-
Primary Tenant
-
Lease Start
-
Lease End
-
Item ID
Step 5 - Review the Projected Revenue Grid
The main projected revenue table displays:
-
Twelve monthly columns based on the selected date range
-
Three annual total columns
-
Total rows
-
Totals summary sections
Use the monthly columns to review expected revenue period by period.
Use the annual totals to understand broader revenue expectations across the selected range.
Expected Display
-
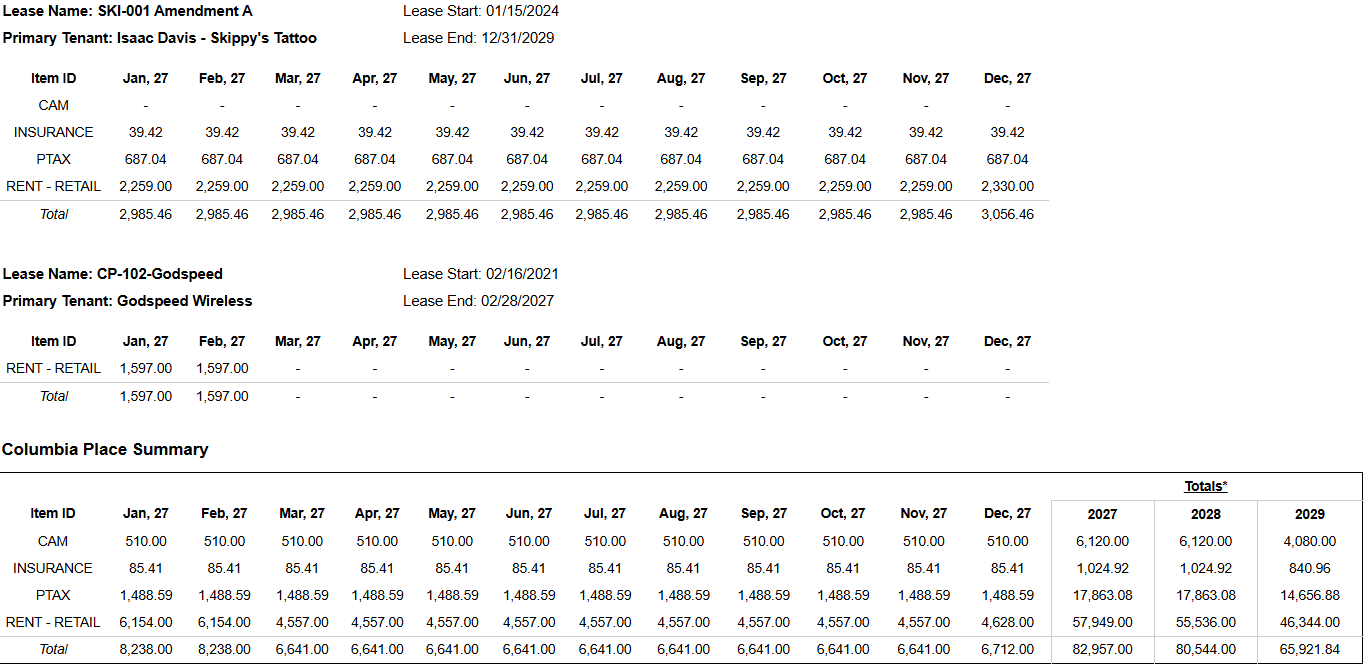
Results are grouped by Property
-
Within each property, revenue is organized by Lease Name and Item ID
-
Monthly columns reflect the months included in the selected reporting range
-
Annual totals summarize projected revenue for each year shown
3. Technical Explanation
Date and Filter Behavior
This report calculates projected revenue based on the selected From Date and To Date range.
The monthly columns displayed in the report dynamically reflect the months included in this selected date range.
User filters applied in the report include:
-
Entity ID
-
Property Name
-
From Date
-
To Date
-
Item ID
-
Lease Status
-
Month to Month
Date parameters filter the amount assigned to the months and the corresponding proration is calculated when applicable.
Table Structure
The report is structured to allow revenue analysis at several levels:
-
Property level for portfolio or site-level review
-
Lease level for individual lease revenue forecasting
-
Item ID level for charge-specific revenue review
The layout includes:
-
property grouping sections
-
lease and item-level revenue rows
-
summary totals within each section
Annual Total Behavior
The annual total columns summarize the monthly projected revenue values within each year displayed.
When the selected date range does not cover a full calendar year, the annual totals include only the months that fall inside the selected reporting range.
Granularity Explanation
The report maintains charge-level granularity so users can trace projected revenue back to specific lease charges.
This allows the report to support both:
-
high-level revenue forecasting
-
detailed verification of the lease commitments contributing to projected revenue
4. Troubleshooting
No Data Returned
Possible causes:
-
Selected Property Name, Lease Status, or Item ID values do not match available records
-
The selected From Date and To Date exclude the periods you want to review
Possible fixes:
-
Confirm the selected property and lease filters
-
Expand the date range
-
Temporarily remove optional filters and rerun the report
Projected Revenue Appears Incomplete
Possible causes:
-
The selected date range does not include the months you expect to review
-
The selected Item ID values exclude certain revenue types
Possible fixes:
-
Review the selected From Date and To Date
-
Confirm that the appropriate Item ID values are included
Annual Totals Look Lower Than Expected
Possible causes:
-
Annual totals only include months that fall within the selected reporting range
Possible fixes:
-
Review the monthly columns displayed in the report
-
Expand the reporting date range if needed
Expected Lease Is Missing
Possible causes:
-
The lease does not belong to the selected property
-
The lease does not match the selected Lease Status or Month to Month filters
Possible fixes:
-
Confirm property selection
-
Broaden Lease Status values
-
Review Month to Month filter settings
5. Customization
Possible enhancements for this report include:
Layout and Grouping Changes
-
Changing the grouping order between property, lease, and item
-
Adding more contextual fields to lease-level sections
Revenue Analysis Enhancements
-
Extending the report to show additional projected months
-
Adding more annual total columns
Export and Reporting Improvements
-
Adjusting export formatting for planning or budgeting workflows
-
Adding summary sections for portfolio-level revenue review
These modifications can be requested as a report customization through the customer portal.