1. Introduction
Purpose
The Square Footage Reconciliation report helps users compare property-level square footage against the sum of unit-level square footage. It is intended to highlight whether the units assigned to a property reconcile to the total square footage recorded for that property as of a selected date.
The report is designed to work with different square footage types by selecting them one at a time through a parameter, allowing comparison with the property's square footage.
Aggregation Level
This report is presented at multiple levels.
It includes:
-
an overall summary for the selected properties (company-level)
-
a property-level reconciliation section
-
unit-level detail grouped by Property and Unit Class
This makes the report useful both for high-level review and for identifying specific units that contribute to a reconciliation difference.
2. How to Use the Report
Step 1 - Select Filters
Open the report and set the parameters in the following order:
-
Entity ID (multi-select)
-
Property Name (multi-select)
-
As of Date
-
Sqft Type (one-select)
-
Unit Status (multi-select, active by default)
Step 2 - Run the Report
After selecting the parameters, run or refresh the report.
Step 3 - Validate Header Information
At the top of the report, review the following:
-
Square Footage Reconciliation
-
Execution time
-
As of Date
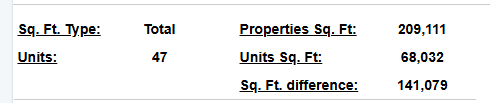
Step 4 - Review the Summary Metrics
At the top of the report, review the summary metrics:
-
Sq. Ft. Type
-
Units
-
Properties Sq. Ft
-
Units Sq. Ft.
-
Sq. Ft. difference
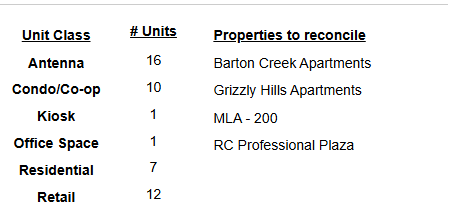
Step 5 - Review the Property Reconciliation Section
The report then shows a property-level reconciliation section, including:
-
Properties to reconcile
-
Property Sq Ft
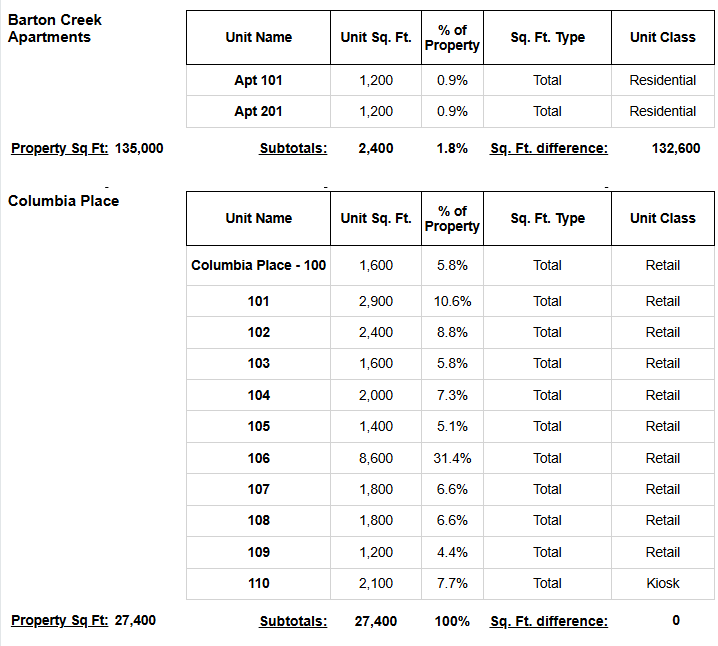
Step 6 - Review the Unit Detail Table
Within each property, review the unit detail table with these visible headers:
-
Unit Name
-
Unit Sq. Ft.
-
% of Property
-
Sq. Ft. Type
-
Unit Class
Each property section also includes:
-
Subtotals
-
Sq. Ft. difference
Use the property totals and unit subtotals together to identify where the total property square footage does not match the sum of the included unit square footage.
Expected Display
-
The report includes an overall summary for the selected properties
-
Each property has its own reconciliation section
-
Unit detail rows are grouped by Property and Unit Class
-
Subtotals and difference values help identify reconciliation gaps
3. Technical Explanation
Date and Filter Behavior
This report provides a point-in-time reconciliation based on the selected As of Date.
It does not show a trend over time. Instead, it compares the total square footage recorded for each property against the square footage returned for the units within that property.
This report applies filtering using the following parameters:
-
Entity ID
-
Property Name
-
As of Date
-
Sqft Type
-
Unit Status
Table Structure
The report is structured at the unit level because reconciliation requires visibility into the individual units contributing to the property total.
Those unit rows are grouped under each property so users can compare:
-
the property-level square footage
-
the subtotal of unit square footage
-
the resulting Sq. Ft. difference
The report also includes an overall summary section that aggregates the selected properties and shows:
-
combined Properties Sq. Ft
-
combined Units Sq. Ft.
-
portfolio-level Sq. Ft. difference
This helps users determine whether the reconciliation issue is isolated to one property or spread across multiple properties.
Granularity Explanation
The report maintains unit-level granularity so users can identify which individual units contribute to a reconciliation variance.
The % of Property column helps show each unit's share of the property total, which is useful when investigating larger reconciliation gaps.
Grouping by property and unit class makes it easier to analyze both the detailed rows and the subtotal impact in the same layout.
4. Troubleshooting
No Data Returned
Possible causes:
-
The selected Property Name values are incorrect
-
The selected As of Date does not align with the units or square footage records you expect to review
-
The Unit_Class filter is too restrictive
Possible fixes:
-
Confirm the selected Property Name values
-
Try a different As of Date
-
Remove some filters, such as Unit_Class, and rerun the report
Square Footage Difference Is Larger Than Expected
Possible causes:
-
Not all expected units are included in the report
-
The selected Sqft_Type is not the intended square footage basis for reconciliation
-
Some units are excluded by the current filter combination
Possible fixes:
-
Review the unit rows under the affected property
-
Confirm that the selected Sqft_Type is correct
-
Compare the property-level Property Sq Ft with the Subtotals section
Expected Units Do Not Appear
Possible causes:
-
The units do not belong to the selected properties
-
The unit does not match the selected Unit_Class filter
Possible fixes:
-
Verify that the units belong to the selected properties
-
Confirm the Unit_Class selection
-
Re-run the report with fewer filters to isolate the issue
5. Customization
Possible enhancements for this report include:
Summary Enhancements
-
Adding more property summary metrics
-
Adding portfolio-level reconciliation indicators
Detail Table Enhancements
-
Expanding the detail table with additional unit attributes
-
Adding exception-focused columns to support reconciliation review
Layout and Reporting Improvements
-
Changing the grouping layout for easier reconciliation analysis
-
Adding exception-only sections that highlight properties with a difference
-
Refining export formatting for data cleanup or operational review
These modifications can be requested as a report customization through the customer portal.