1. Introduction
Purpose
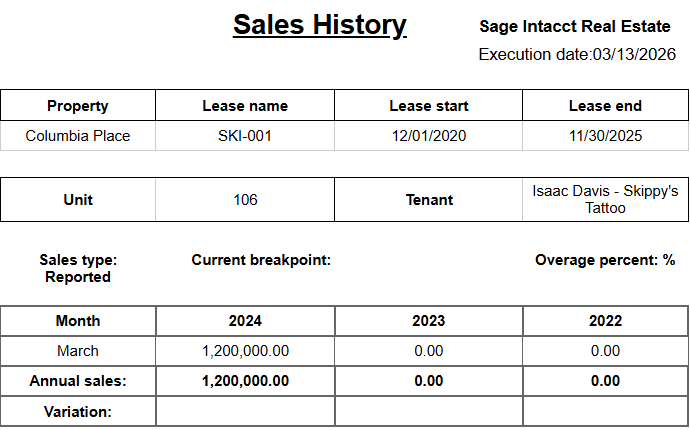
The Sales History report helps users review sales performance by lease across multiple years.
It is designed to show monthly sales activity, annual sales totals, and sales variation side by side so users can compare trends over time.
Aggregation Level
This report is primarily presented at the lease level, with supporting context for the related Property, Unit, and Tenant.
It also displays the applicable Sales type, Current breakpoint, and Overage percent for the lease being reviewed.
2. How to Use the Report
Step 1 - Select Filters
Open the report and set the parameters in the following order:
-
Entity ID (multi-select)
-
Property Name (multi-select)
-
Lease Name (multi-select, optional if you want to narrow results)
-
Sales type
-
Sales category (multi-select)
Step 2 - Run the Report
After selecting the filters, run or refresh the report.
Step 3 - Validate Header Information
At the top of the report, verify the following:
-
Sales History report title
-
Execution date timestamp
Step 4 - Review the Lease Header Information
For each lease returned, confirm the identifying information shown in the header area:
-
Property
-
Lease name
-
Lease start
-
Lease end
-
Unit
-
Tenant
Step 5 - Review the Sales Context
Below the lease header, review the sales context shown for the lease:
-
Sales type
-
Current breakpoint
-
Overage percent
Step 6 - Review the Main Table
The main table displays the following columns:
-
Month
-
2024
-
2023
-
2022
-
Annual sales
-
Variation
Use this layout to compare monthly sales by year and to review the annual total and variation shown for each lease.
Expected Display
-
Each returned section represents one lease
-
Monthly sales values are displayed side by side across multiple years
-
Annual sales summarizes the yearly totals shown in the report
-
Variation helps compare year-over-year movement
3. Technical Explanation
Table Structure
This report brings together sales history for three years at a time in the current layout:
-
2024
-
2023
-
2022
For each lease displayed, the report aligns sales by Month so users can compare the same period across years in a single view.
Monthly Transactions Only: We are computing sales exclusively from transactions with a monthly transaction type.
Ignoring Future Sales: Sales with transaction dates beyond the current date are not included.
Relevant Properties and Leases: Only properties and leases with at least one sales entry will be displayed.
Granularity Explanation
The report is structured at the lease level because sales performance, breakpoint review, and overage analysis are typically evaluated for each lease individually.
Property and tenant details are included to help users confirm they are reviewing the correct lease.
Sales Context Fields
The Annual sales row summarizes the yearly sales values shown in the report.
The Variation row helps users compare year-over-year movement.
The Current breakpoint and Overage percent provide additional context for understanding whether sales levels are approaching or exceeding lease thresholds.
4. Troubleshooting
No Data Returned
Possible causes:
-
The selected Entity ID, Property Name, and Lease Name combination does not match available sales records
-
The selected Sales type or Sales category is too restrictive
Possible fixes:
-
Reduce the number of filters and rerun the report
-
Confirm that the selected properties and leases are valid for the sales records you expect to review
-
Verify that the selected Sales type and Sales category match the lease activity you want to analyze
Expected Lease Does Not Appear
Possible causes:
-
The lease does not belong to the selected property or entity
-
The Lease Name filter is narrowing the results too much
Possible fixes:
-
Check whether the lease belongs to the selected property and entity
-
Remove the Lease Name filter temporarily and rerun the report
Annual Totals or Variation Look Unexpected
Possible causes:
-
The comparison is based on the monthly values shown for 2024, 2023, and 2022
-
The wrong lease or sales type may be selected for the review
Possible fixes:
-
Review the monthly values in the table before interpreting the totals or variation
-
Confirm that you are analyzing the intended lease and sales type
Breakpoint Information Is Blank or Not Meaningful
Possible causes:
-
Some leases may not have current breakpoint or overage information available in the report output
Possible fixes:
-
Reconfirm that the lease and sales type selected are the intended records for review
-
Compare with other leases in the same reporting context if needed
5. Customization
Possible enhancements for this report include:
Year Comparison Changes
-
Add newer or older years to the comparison table
-
Change the labels or formatting of the year columns
Header and Context Enhancements
-
Add additional lease details in the header section
-
Expand the sales context shown for each lease
Reporting Enhancements
-
Include summary sections by property or entity
-
Expand export formatting for easier downstream analysis
These modifications can be requested as a report customization through the customer portal.